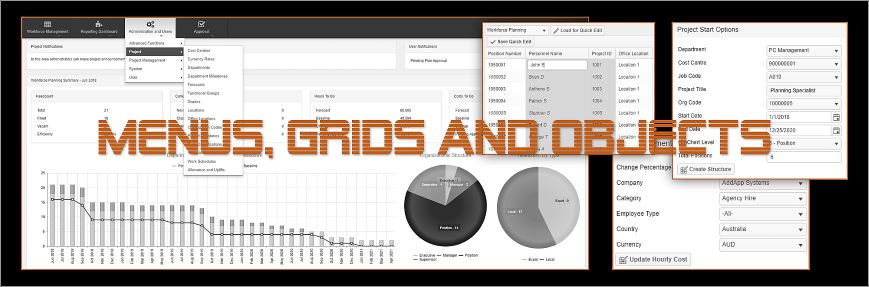
Our user friendly interface is fully customizable, choose design colors, setup, charts, reports and even data columns.
System menu is easy to navigate and advanced QA/QC code controls the data input to eliminate errors.
Data edit and view includes grid and single forms.
There is no refresh in the data screens until users navigate to a different page.
Users can chose columns, drag and drop grouping, filters and even resize columns and text boxes on the forms.
All data screens are exportable and can be used to create reports.
Systems are designed with user communication and work notifications.
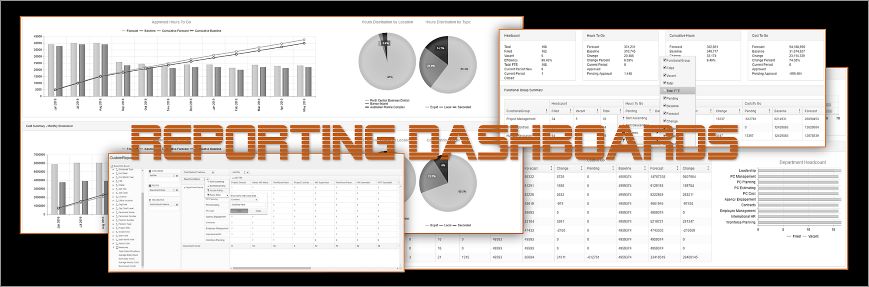
Reporting Dashboards
Reporting has never been easier with our drag and drop and check/uncheck Reporting Dashboards.
Users control what to display and export in PDF or Excel. All objects in the reports, including whole sections, can be modified.
Users can add additional charts, specify reporting periods and even modify data tables.
Additional Custom Report Builder enables users to create any ad-hoc reports.
To generate tables and charts, simply drag and drop data fields and measurements into the query sections.
Reporting Dashboards are fully customizable as per Client requirements.
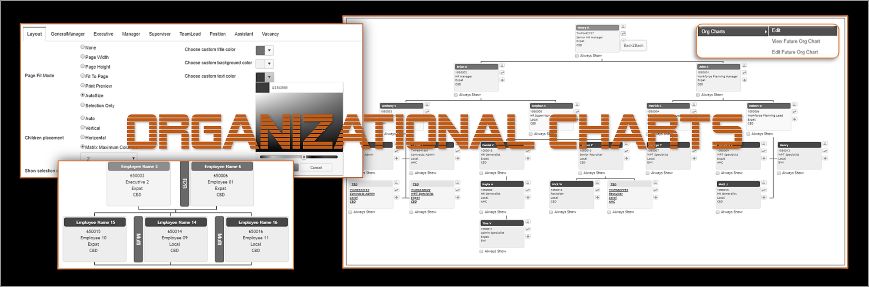
Organizational Charts
Intelligent drag and drop chart module provides efficiently designed organizational charts and automatically updates the project reporting structure.
Our systems support department and project charts and can be displayed in a single chart view or as a structured department chart.
Charts can be created on User and Department levels. Each user can design and save their own charts without affecting the official organizational structure.
Use the template options to change colors and display, to group back to back positions or whole teams.
Generate current and future charts for your organization.